Most IT organizations are drowning in alerts while remaining completely blind to actual service health. When a monitoring tool fires 5,000 threshold alerts a week, engineers suffer from cognitive fatigue and reflexively ignore notifications—until an outage hits critical business operations.
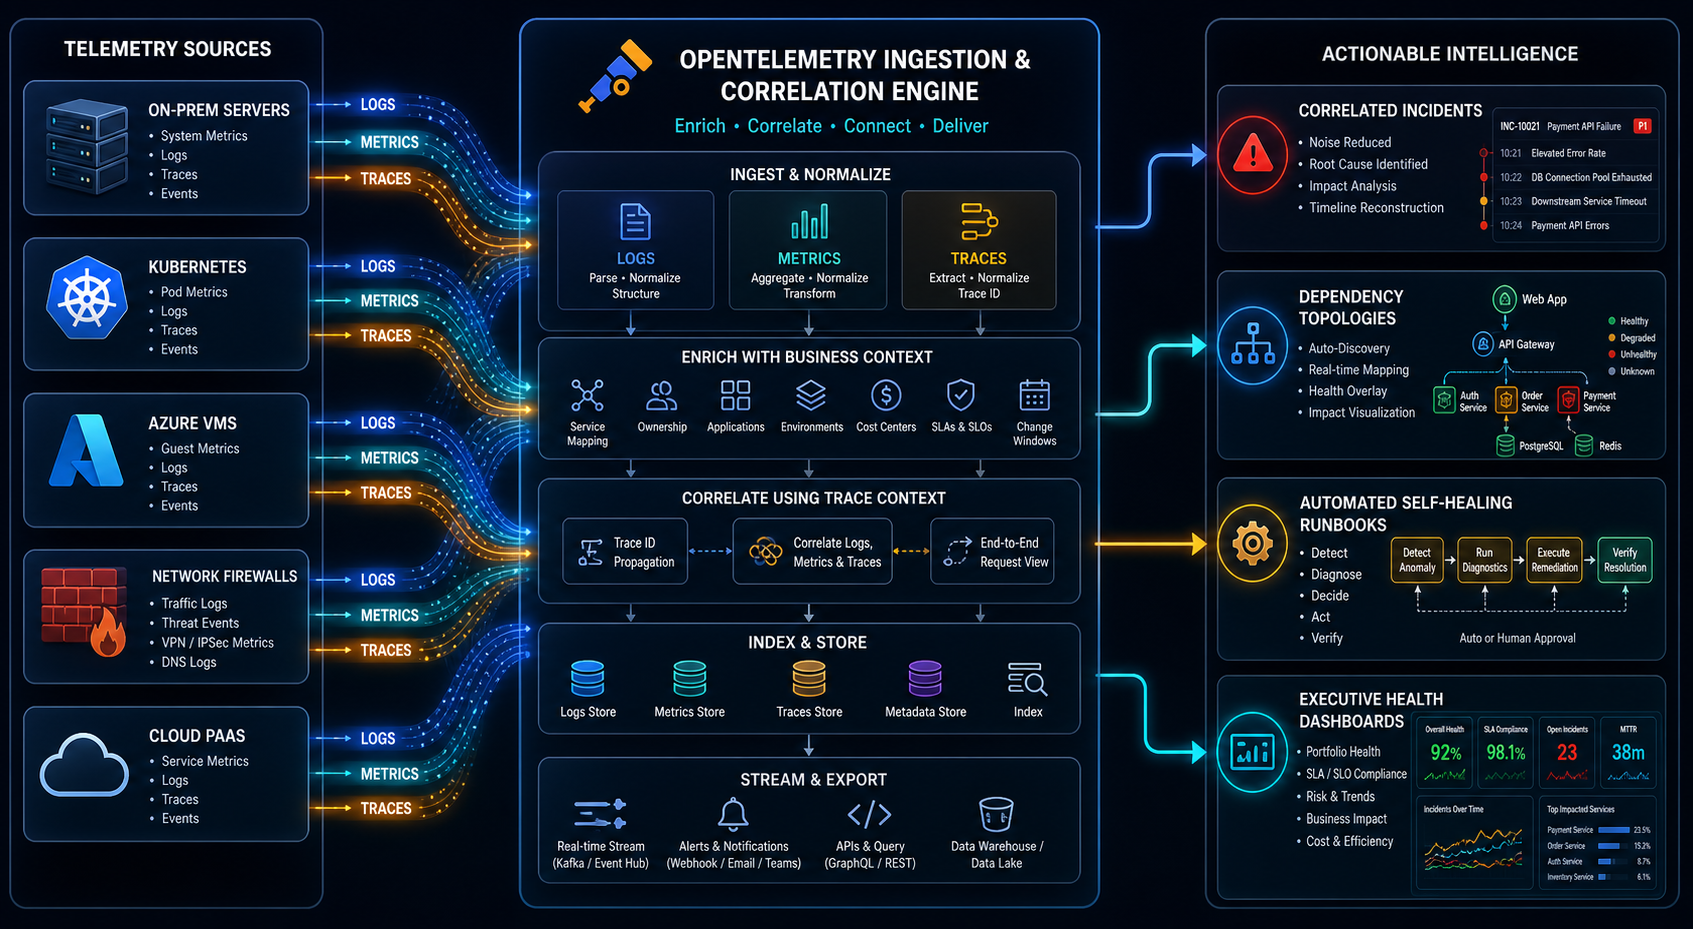
Observability is fundamentally different from traditional monitoring. While monitoring asks 'Is this specific server CPU above 90%?', observability asks 'Why is checkout latency degrading for customers in Europe, and what system dependency is causing it?'. Observability correlates metrics, logs, distributed traces, and business context into actionable operational intelligence.
Alert Noise Reduction
Decrease in raw notifications achieved via telemetry correlation and dynamic baselining.
Mean Time to Diagnose (MTTD)
Average time to identify root-cause dependency failure across hybrid infrastructure.
Service Context Mapping
All telemetry streams enriched with business service, client, and environment tags.
1. The Three Pillars of Observability vs. Traditional Monitoring
| Telemetry Stream | Traditional Monitoring (Isolated) | Modern Observability (Correlated) | Diagnostic Value |
|---|---|---|---|
| Metrics (Health) | Static CPU/RAM threshold alarms. | Dynamic time-series anomalies mapped to transaction volumes. | Detects performance degradation before total failure occurs. |
| Logs (Context) | Disconnected syslog and Windows event log files. | Structured JSON logs correlated with unique distributed trace IDs. | Pinpoints exact code exceptions or SQL query failures instantly. |
| Traces (Path) | Unmonitored network transit times. | End-to-end request tracing across client, API, database, and cloud PaaS. | Visualizes exact bottleneck latency across distributed microservices. |
“If an alert does not require an immediate, distinct human action, it is not an alert—it is log data. Stop waking engineers up for telemetry noise.”
2. Implementing OpenTelemetry and Service Context
To prevent vendor lock-in and ensure standardized data collection across hybrid estates, organizations must adopt OpenTelemetry (OTel) standards. Every telemetry stream must be enriched at the point of ingestion with mandatory contextual metadata: ServiceName, Environment (Prod/Staging), OwnerTeam, and ClientID.
Observability Implementation Checklist
- Eliminate all static threshold alerts that have not triggered an operational runbook in the last 90 days.
- Ingest distributed traces across all business-critical APIs using OpenTelemetry collectors.
- Build Service Level Objective (SLO) dashboards tracking error budgets rather than raw infrastructure uptime.