Most IT Managed Service Providers (MSPs) stall between $2M and $5M in annual recurring revenue (ARR) not because they lack technical skill, but because their commercial sales engine makes promises that their operational delivery architecture cannot sustainably execute.
Scaling an MSP is fundamentally an exercise in variance reduction. When an IT provider onboards clients with bespoke infrastructure, unstandardized software tools, and divergent SLA expectations, operational drag expands non-linearly. The service desk absorbs intense cognitive friction, technician utilization collapses into reactive fire-fighting, and gross margins erode beneath the surface of top-line revenue growth.
Optimal Tech Utilization
Maximizes labor gross margin (55%+) without triggering engineer burnout or turnover.
Target Noise Index
Maximum monthly reactive tickets generated per managed endpoint across the client fleet.
Services-to-Labor Ratio
Direct recurring service revenue divided by total fully burdened engineering labor cost.
1. The Four Growth Traps of Early-Stage MSPs
Sustainable commercial expansion requires identifying and methodically dismantling the four structural operational traps that turn customer acquisition into margin compression:
- The Hero-Culture Delivery Trap: Relying on Tier 3 escalation specialists to compensate for undocumented customer configurations and weak standard operating procedures.
- Stack Proliferation (The “Say-Yes” Problem): Supporting four different backup vendors, three firewalls, and mixed endpoint security platforms across a 40-client base.
- Unscoped Professional Services Creep: Absorbing cloud migrations and identity restructuring into flat-rate managed agreements without clear boundary riders.
- Margin-Blind Sales Compensation: Incentivizing business development teams on gross bookings rather than post-onboarding gross margin and stack compliance.
“You do not scale an MSP by closing more tickets; you scale by systematically eliminating the operational conditions that generate tickets in the first place.”
2. Service Line Unit Economics & Contribution Margins
Building a resilient management system requires segmenting revenue streams into distinct margin profiles and enforcing clear operational delivery boundaries:
| Service Line | Target Gross Margin | Key Metric Indicator | Primary Operational Risk |
|---|---|---|---|
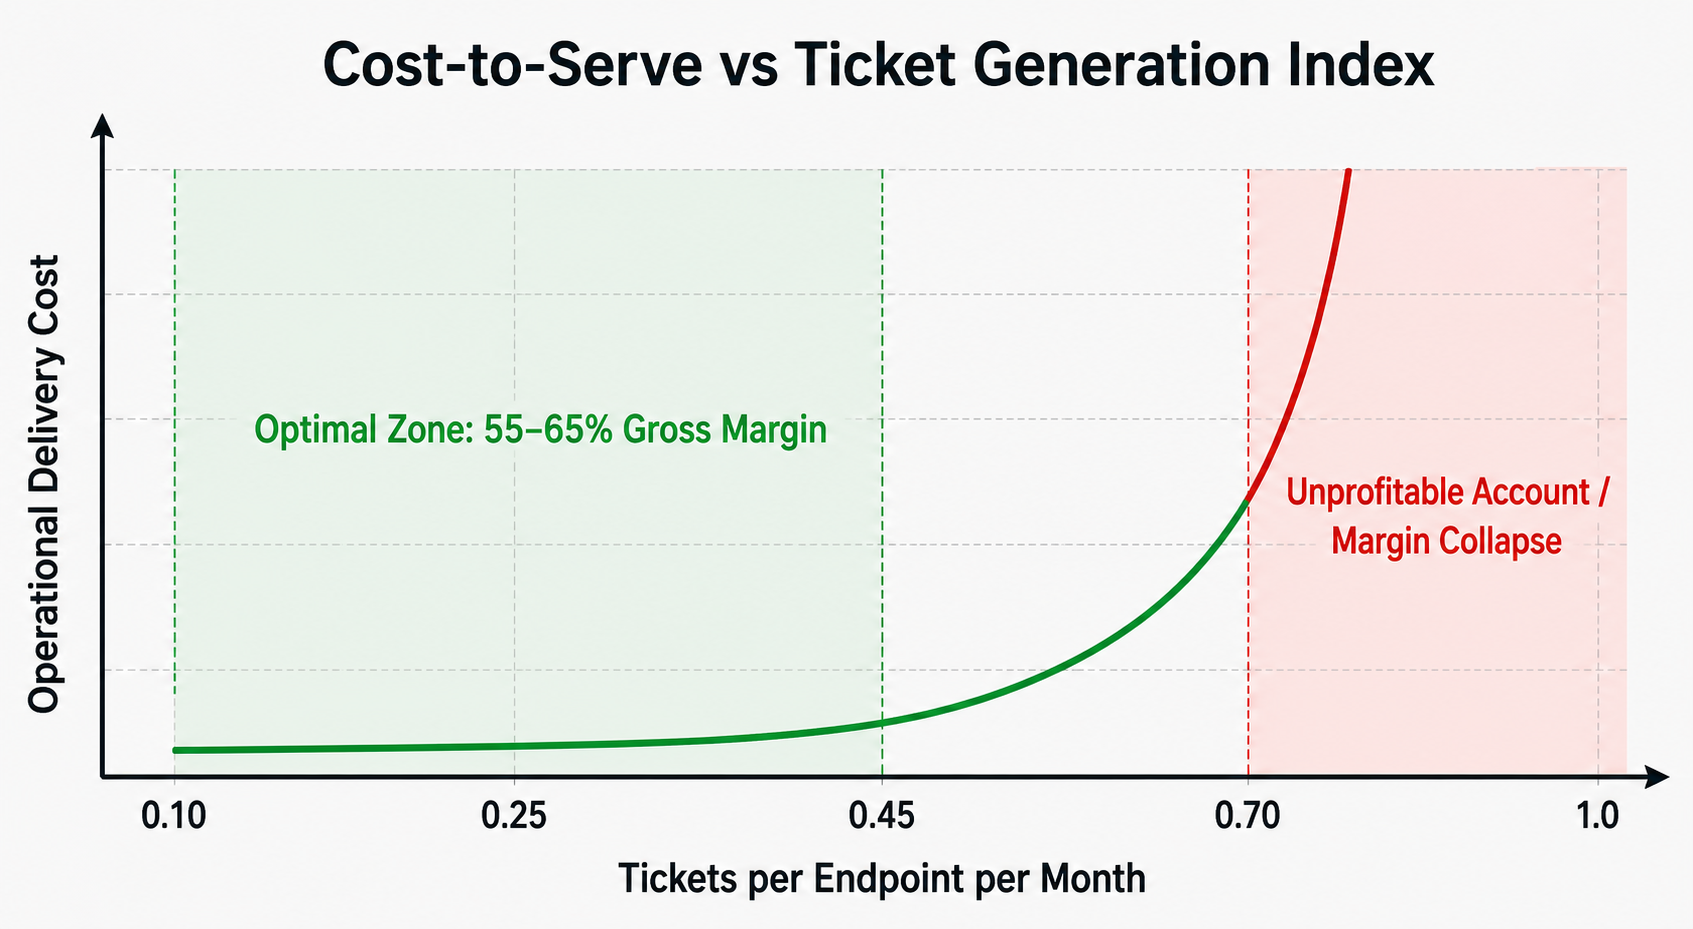
| Fully Managed Recurring (Per User/Device) | 55% – 65% | Tickets / Endpoint / Month (< 0.45) | Custom application sprawl and legacy OS patching overhead. |
| Co-Managed IT (Enterprise/Mid-Market) | 45% – 55% | Escalation First-Touch Resolution (> 75%) | Scope ambiguity between internal client IT and MSP queues. |
| Professional Services & Projects | 40% – 50% | Effective Hourly Realization Rate (> $185/hr) | Fixed-fee scope creep and untested migration dependencies. |
| Cloud & SaaS Resale (CSP/Licensing) | 14% – 22% | Rebate Capture & Billing Reconciliation | Unreconciled seat counts and unused subscription waste. |
3. The Operational Playbook for Systematic Scale
Phase A: Mandating Stack Standardization
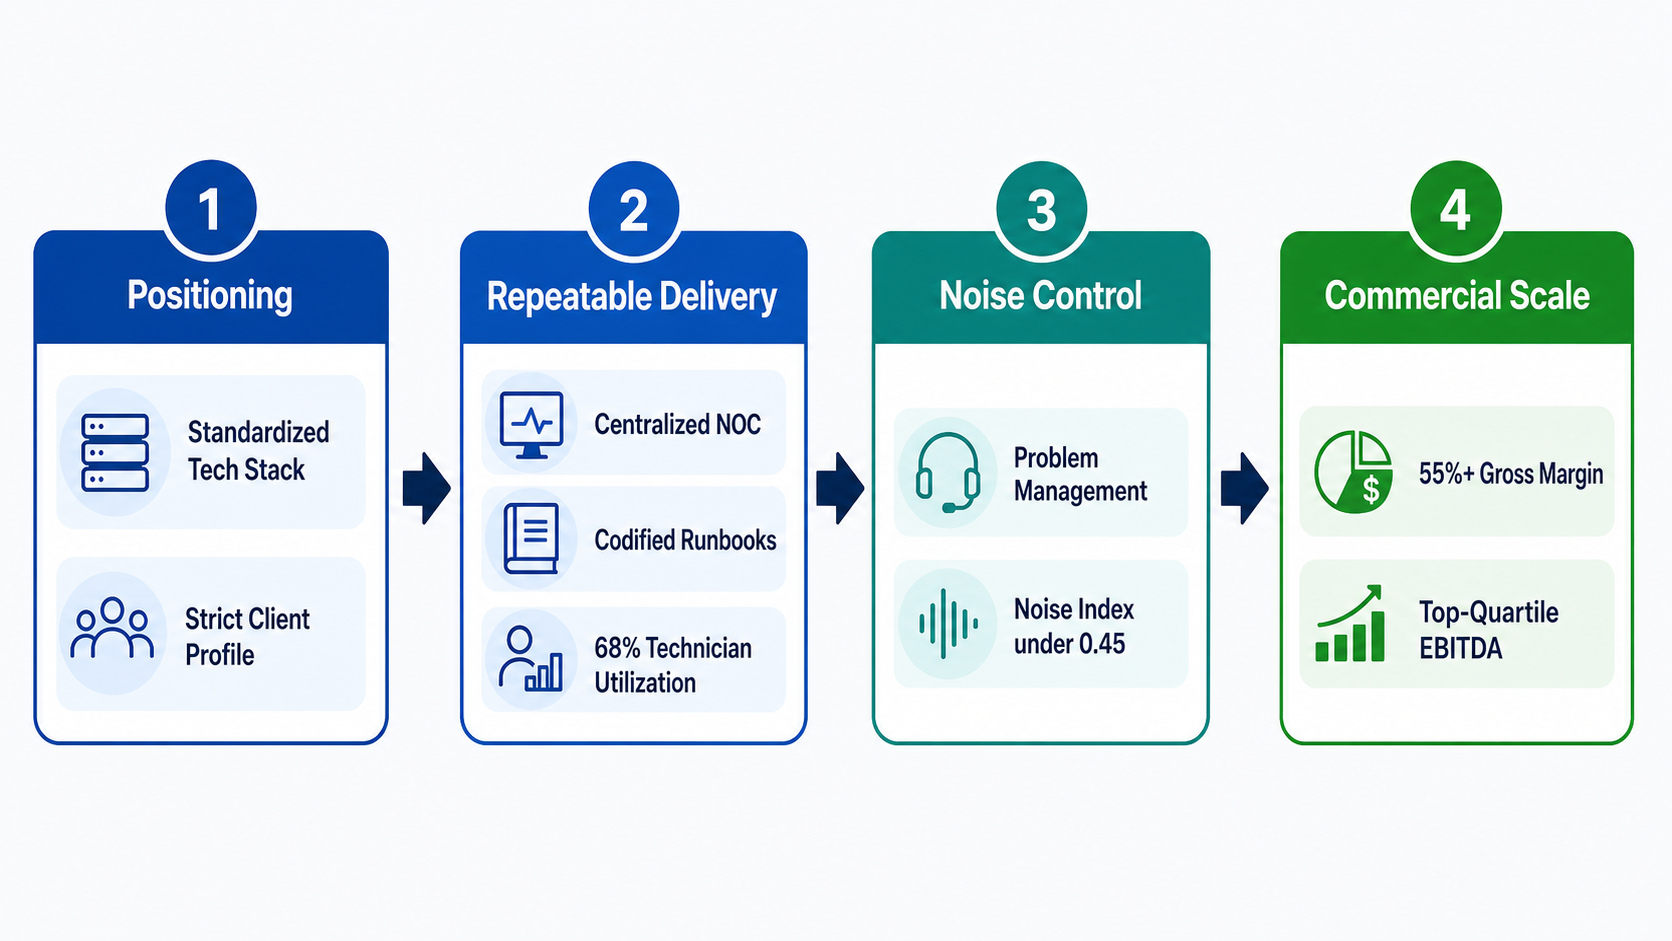
Enforce an explicit commercial requirement: prospective and existing clients must align with your validated technology stack (Identity, Endpoint Protection, BCDR, and Secure Networking). Non-standard environments incur an architectural support surcharge and are scheduled for mandatory remediation within 90 days of onboarding.
Phase B: Institutionalizing Triage & Escalation Cadence
Decouple Tier 1 intake from Tier 2/3 engineering escalations. Implement rigorous ticket taxonomy, enforce SLA tracking based on restoration time rather than mere acknowledgment, and establish continuous problem management cadences to eliminate recurring noise triggers at the root-cause level.
Phase C: Strategic Executive Reviews (vCIO/QBR)
Shift Quarterly Business Reviews away from passive metric reporting and center discussions on executive risk mitigation: hardware lifecycle status, multi-factor authentication coverage, business continuity audit results, and prioritized technology roadmaps.
Executive Scaling Checklist
- Audit client technology compliance: compute true cost-to-serve and delivery margin across your top 20 accounts.
- Institute dedicated Problem Management hours to eradicate recurring telemetry and alert noise.
- Price agreements around infrastructure availability and measurable security controls rather than commoditized per-user hourly rates.