Dividing total monthly ticket volume by an arbitrary number like '300 tickets per tech per month' is the most common reason service desks experience sudden operational collapse.
Raw ticket volume ignores the fundamental physics of engineering labor: incident complexity variance, interruption latency, escalation drag, administrative overhead, and the massive cognitive cost of context switching. Accurate capacity planning requires modeling engineer utilization around sustainable queue physics (Erlang-C principles) rather than simple linear averages.
Optimal Queue Utilization
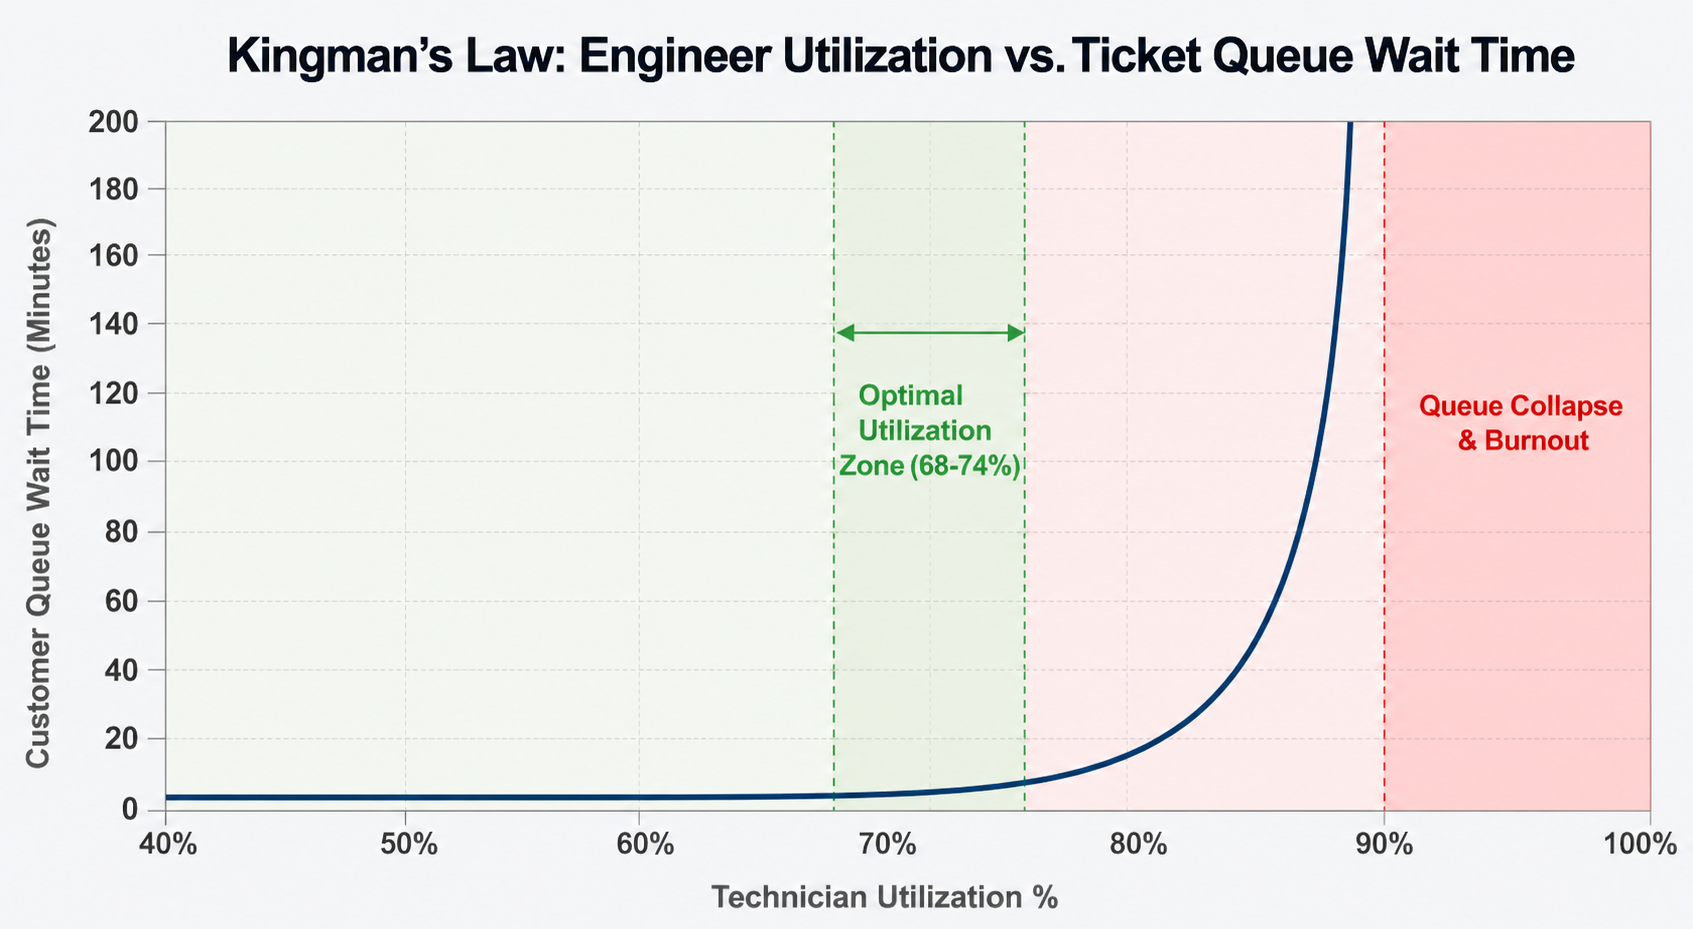
Beyond 75% utilization, service desk wait times expand exponentially (Kingman’s Law).
Context-Switching Tax
Average cognitive recovery time required after an unscheduled technical interruption.
Burdened Shift Multiplier
Total headcount required to cover 1 full-time desk seat accounting for leave, training, and admin.
1. The Nonlinear Math of Queue Physics (Kingman's Formula)
When service desk leadership pushes engineer utilization above 80% to 'maximize labor efficiency', ticket wait times and SLA breaches do not increase linearly—they explode exponentially.
| Technician Utilization Level | Operational State | Queue Wait Time Impact | Service Delivery Outcome |
|---|---|---|---|
| 50% – 65% | Under-Utilized Queue | Minimal wait times; rapid response. | Lower labor gross margin; idle engineering capacity. |
| 68% – 74% | Optimal Operational Balance | Predictable wait times; fast restoration. | 55%+ gross margins, sustainable burnout-free on-call. |
| 80% – 88% | Degraded Friction State | Wait times triple; SLA breaches spike. | Escalation engineer burnout; missed project deadlines. |
| 90%+ | Catastrophic System Failure | Infinite queue backlog; engineers quit. | Client churn, catastrophic SLA failure, extreme turnover. |
“A service desk operated at 95% utilization is not an efficient organization; it is a traffic jam waiting for one minor accident to trigger total gridlock.”
2. The Fully Burdened Engineering Capacity Equation
To calculate true frontline engineering capacity ($C_{net}$), operations leaders must deduct non-ticket operational overhead from gross billable hours:
- Gross Available Hours per Tech: 160 hours / month.
- Less Administrative & Handoff Overhead (15%): -24 hours.
- Less Continuous Training & CoE SOP Review (10%): -16 hours.
- Less Context Switching Interrupt Tax (12%): -19 hours.
- Net Productive Triage Capacity: ~101 hours / month.
Capacity Planning Governance Checklist
- Cap scheduled technician utilization targets at 72% across all reactive service queues.
- Separate dedicated Project Engineers from Reactive Support Engineers to eliminate context-switching drag.
- Apply a 1.35x staffing multiplier when budgeting 24/7 or shift-based rotation coverage.